
Live Forecasts Widget
The Live Forecasts widget is a live feed of trading forecasts, with filters for finding the setups that matter to you. Forex, crypto, stocks, indices, commodities, and metals appear in one list.
What you see on your plan
Every tier runs the same detection and scoring engine, but what reaches your feed differs.
| Watch | Core and above | |
|---|---|---|
| Feed | Delayed 15 minutes | Real time, full feed |
| Confidence | Capped at 60% | Full range |
| Methodology families | 2 of 8 | All 8 |
| Forecast analysis detail | Chart and header only | Full analysis |
If your feed looks sparse or empty on Watch, this is usually why rather than a fault. The 60% cap in particular means higher scoring setups do not appear at all.
Adding it to a workspace
Click Widget in the top bar. Pick Live Forecasts from the list, or choose Open Widget Store to add several widgets at once.
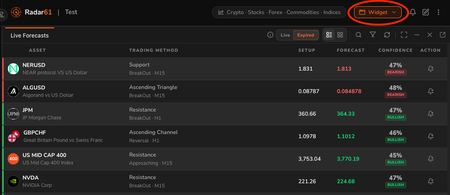 The Add Widget menu in the top bar.
Widget capacity depends on your plan: 3 widgets per section on Watch, 8 on Core, unlimited on Pro. Widgets can also share a panel as tabs, which is how the Technical Analysis app fits Live Forecasts and Alerts into one space.
Reading a row
Each row is one forecast.
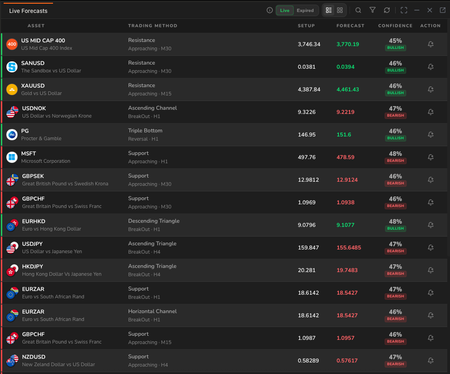
A single forecast row.
- The coloured bar on the left edge shows direction at a glance. Green for bullish, red for bearish.
- Asset shows the instrument, with either its full name or its method line beneath, depending on how wide the widget is.
- Trading method is the pattern, with the category and timeframe beneath it. Some forecasts have no category, in which case only the pattern and timeframe appear.
- Setup is the entry price the structure is built on.
- Forecast is the price the structure projects toward. It is green for bullish forecasts and red for bearish ones.
- Confidence shows the percentage, with the direction badge beneath it. The percentage is colour coded by value.
- Action holds the alert button.
For a full walkthrough of what each field means, see Reading a Forecast.
Copying a price
Hover over the setup or forecast price and a copy icon appears beside it. Click it to copy that price to your clipboard, ready to paste into your broker or your notes. A green tick confirms the copy.

How the layout adapts
The widget rearranges itself depending on how much width it has, which matters because narrow widgets hide prices.
| Width | What you see |
|---|---|
| Narrow | Asset with category, pattern, and timeframe beneath it, plus confidence and the alert button. Setup and forecast are hidden. |
| Medium | Setup and forecast prices appear. |
| Wide | Trading method moves into its own column, and the asset shows the instrument's full name instead. |
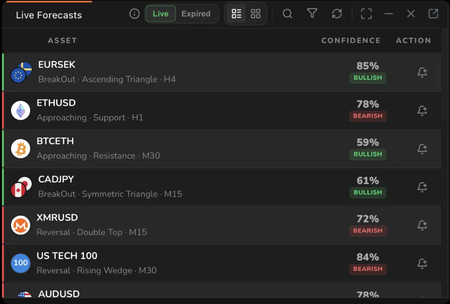
The narrow layout. Setup and Forecast are hidden.
If you cannot see the prices, widen the widget or pop it out into its own window. Pop-outs are capped by plan: 2 on Watch, 5 on Core, 10 on Pro.
Views
The two icons in the header switch between list and grid.
List view is the dense table described above, for monitoring many forecasts at once.
Grid view shows forecasts as cards, with a sparkline of the detected pattern's shape alongside the asset, pattern, and confidence score.
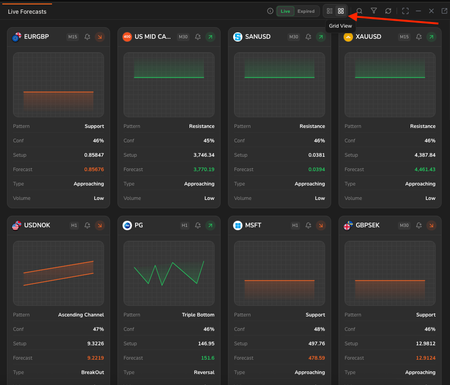
Ordering
The feed is ordered by when each forecast was found, newest first. It is not ordered by confidence, so position in the list tells you nothing about score. There is no sort control, so use the filters to narrow by conviction.
Opening a forecast
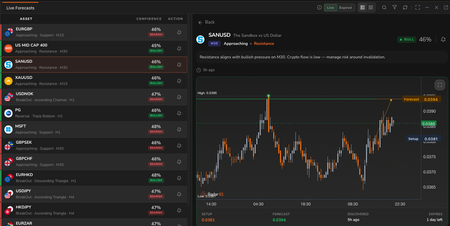
Click any row to open Forecast Analysis, a detail panel showing the forecast drawn on a chart along with its validity and expected range. The selected row stays highlighted while the panel is open, and Back returns you to the feed.
Depending on the space available, the panel either opens beside the feed or takes over the full widget.
Rows are keyboard accessible, so you can tab to a forecast and press Enter or Space to open it.
Creating and managing alerts
The bell button in the Action column creates an alert on that forecast immediately. There is no dialog to fill in; it takes the instrument, timeframe, pattern, and direction straight from the row.
The button tells you the alert's state:
| Icon | Meaning |
|---|---|
| Bell with a plus | No alert yet. Click to create one. |
| Filled amber bell | An alert is active and watching. |
| Pause icon | The alert exists but is paused. |
| Spinner | The alert is being created or updated. |
Once an alert exists, clicking the button opens a short menu instead of creating a duplicate, with options to pause or resume it, or delete it.
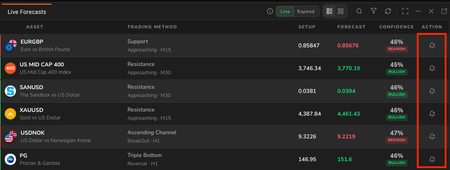
Caption: The alert button in the Action column.
See Alerts for the full range of alert conditions. Alerts require Core or above.
Live and expired
The Live and Expired toggle switches between forecasts still in play and those that have closed.
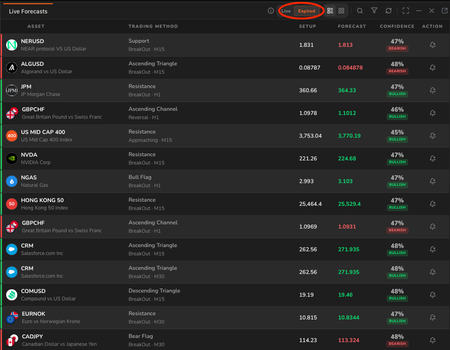
The Live and Expired toggle.
A forecast leaves the Live list in one of three ways:
- Its forecast price is reached. The projected target was met.
- It is stopped out. Price moved against the structure to the level where the setup is considered invalid.
- It expires. The validity window passed without either happening.
Each forecast is given a window proportional to its timeframe, so a D1 forecast stays live far longer than an M15 one. Closed forecasts are kept rather than deleted, so you can review what resolved over a session. Open any of them to see how it ended.
An empty Live list with a full Expired list is normal. It means nothing currently matches your filters.
Filtering
The filter icon opens the Live Forecasts Filters panel.
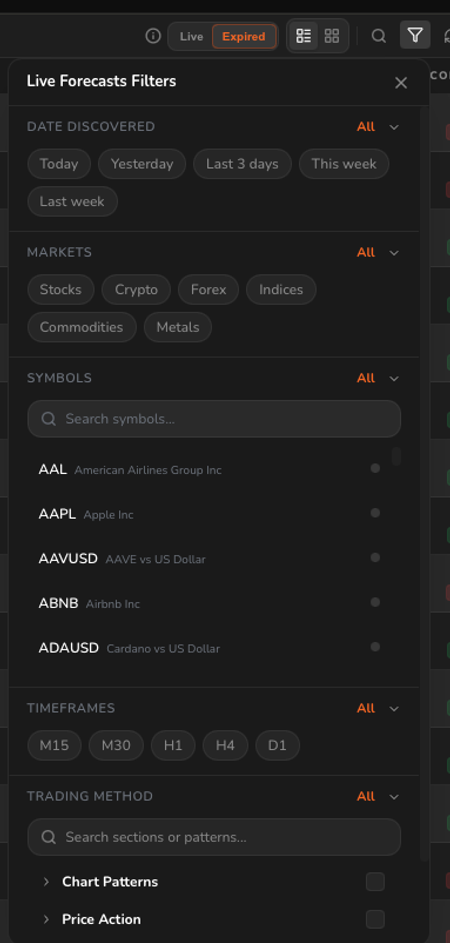
The filter panel, showing all available filter groups.
| Filter | Options |
|---|---|
| Date discovered | Today, Yesterday, Last 3 days, This week, Last week |
| Markets | Stocks, Crypto, Forex, Indices, Commodities, Metals |
| Symbols | Search and select individual instruments |
| Timeframes | M15, M30, H1, H4 |
| Trading method | The methodology groups available on your plan |
| Confidence | High at 80% and above, Medium 60% to 79%, Low below 60% |
Each group has an All control to clear that filter. Filters combine, so selecting Crypto and High confidence shows only crypto forecasts scoring 80% or above.
If the feed shows "No signals match your filters", set each group back to All and check the Live toggle is selected. On Watch, also remember the feed is capped at 60% confidence, so filtering for High will always return nothing.
Other header controls
- Info. Shows a short description of the widget and a Learn more link to this page.
- Search. Find a specific instrument in the current feed.
- Refresh. Pull the latest forecasts.
- Minimise, expand, close, and pop out. Standard widget controls.
Important notes
Price data is delayed. The status bar at the bottom of the workspace shows the data status, the current trading session, and the time. On Watch the feed itself is delayed by 15 minutes.
A forecast target is a projection, not a prediction. Reaching the target is one of several ways a forecast can close.
Related
- Forecast Analysis. The detail panel behind each forecast.
- Reading a Forecast. What each field on a forecast means.
- Confidence scoring. How to read the percentage.
- Alerts widget. Standing alerts so forecasts come to you.